A battery is historically defined as a assembly of multiple cells, which can be connected in series or parallel, but is commonly broadened to include single cells, such as AA, AAA, or C batteries. These systems produce power through a series of chemical reactions, which can be reversed in rechargeable batteries by running energy through the cells. The maximum amount of energy that the battery can output is its capacity, or Ah rating. This rating describes how long, hour (h), the battery can sustain a particular current, Ampere (A) . Note that if you increase double the current, battery might not sustain it for half as long due to reasons we’ll get into below.
The voltage of multicell batteries vary based on the number of cells and their left over capacity, technically called State-Of-Charge (SOC). You can chose the battery chemistry and see the range of voltage for a particular cell count. Voltage varies from the blue dot at fully charged (100% SOC) to the red dot at 0% SOC.
Some systems discharge batteries at constant current(a heater for example), and some discharge at a constant wattage from the battery. A drone for example requires constant power to hover, and so it is common for them to increase current draw as the battery depletes. This is because
Power = Voltage • Current
and current has to increase to supply the same power output as the battery drains. Input the wattage of your system below and see variation in current from a 100% SOC (blue dot) to 0% SOC (red dot).
But most batteries have more weirdness with it’s voltage. Below is the current and voltage of a battery as its discharged from 100% to 0% SOC. Note how the voltage jump up and down as the current is stopped and started. This make it hard to read a battery’s voltage and find its SOC, unless its been resting (without load) for a while.
Modelling the battery
This behavior is since a battery can be modelled as a series of capacitors and resistors. Most of battery’s behavior can be predicted using a simplified (yes, agree that isn’t simple) battery model shown:
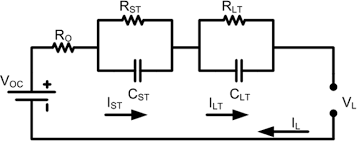
where VOC is the potential energy held by the battery, RO is the internal resistance of the battery, VL is the load or output voltage, IL is the load current, and the ST and LT systems describe the short and long term resistances and capacitances of the battery due to electro-magnetic and electro-chemical effects, respectively. This internal resistance and capacitance cause fluctuation of voltage over periods of use and disuse. VL is the only voltage that can be directly measured from a battery.
Having a high current output rate is disadvantageous, as it lead to heat loss due to the internal resistance of the cells. At low current discharge rates, the internal resistance of the cells makes less of an impact on the capacity due to the formula:
Heat loss in a resistor (W)= Current² • Internal Resistance
Since most batteries’ have small internal resistances, this loss is frequently disregarded. However, high current draw rates can lead to significant power loss.

The immediate jumps when the load is removed (red line) is caused by the resistance present in the internal system due to the formula
Voltage = Current • Resistance
and the slow secondary increase (green curve) is due to the discharge of the capacitances. These idiosyncrasies make it hard to determine the energy remaining in the battery.